
For Directors of Procurement, Vice Presidents of Supply Chain, and Senior Packaging Engineers managing high-volume consumer product portfolios, evaluating packaging proposals strictly on initial FOB factory-gate unit price is one of the costliest procurement mistakes an enterprise can make.
When launching or scaling packaging programs across mass retail and club store channels—including Walmart, Target, Costco, Sam’s Club, Home Depot, Sephora, Ulta, AutoZone, Petco, and PetSmart—the apparent 10% to 20% unit savings offered by offshore converters in Asia frequently dissolves once international freight, port demurrage, customs tariffs, inventory carrying costs, line downtime, and retail non-compliance penalties are tallied.
The Total Landed Cost (TLC) Iceberg in Packaging
Over 45 years of commercial packaging engineering and large-format converting operations, dual-border operations headquartered in San Diego, CA, and advanced manufacturing campuses across Baja California (Tijuana and Mexicali), PM Packaging has engineered high-volume packaging programs for leading Fortune 500 CPGs, hardware manufacturers, and private-label brands.
This guide provides procurement teams, supply chain directors, and packaging engineers with a rigorous, mathematically verified Total Landed Cost (TLC) framework to accurately evaluate nearshore US-Mexico manufacturing against transpacific offshore sourcing and domestic cross-country converting for folding cartons, Single Face Laminate (SFL) microflute packaging, blister cards, and luxury rigid setup boxes.
1. The Total Landed Cost (TLC) Equation for High-Volume Packaging
To capture the true economic impact of packaging procurement, enterprise procurement teams utilize a multi-variable Total Landed Cost equation. This formula accounts for direct converting costs, multi-modal logistics, trade policy, financial capital friction, automated line performance, and retail compliance:
A comprehensive multi-variable algorithm integrating operational, logistics, financial, and retail compliance parameters.
1. Base Unit & Tooling (Cbase)
Press & Board- • Sheet-fed large-format offset lithography & coatings
- • Substrate caliper & basis weight (SBS, CCNB, CUK, SFL)
- • Steel rule die & dynamic blanking tool amortization
2. Freight & Logistics (Cfreight)
Transit- • 40ft High Cube container freight, BAF & peak surcharges
- • Port drayage, terminal handling & chassis splits
- • Dedicated FTL ground freight vs transpacific dwell
3. Tariffs & Customs (Ctariffs)
Trade Policy- • HTS Chapter 48 classification (4819.10 / 4819.20)
- • USMCA 0% duty-free vs Section 301 (7.5%–25%+) duties
- • Merchandise Processing Fees (MPF) & brokerage costs
4. Inventory Carrying (Ccarrying)
Warehousing- • 3PL pallet footprint leasing ($18–$35/pallet/month)
- • Inbound handling, cycle counts & facility overhead
- • Inventory casualty insurance & local inventory tax
5. Working Capital (Cworking_cap)
Liquidity Drag- • Cash Conversion Cycle (CCC) latency across 120-day ocean
- • Corporate Weighted Average Cost of Capital (WACC: 8%–15%)
- • Trapped liquidity unavailable for core commercial growth
6. Quality & Line Speed (Cquality_risk)
Runnability- • Co-packer automated cartoner jams ($500–$1,500/hr)
- • Maritime moisture absorption degrading ECT/BCT strength
- • Color drift exceeding retail GMI tolerances (ΔE > 1.5)
7. Retail Compliance (Ccompliance)
OTIF Fines- • Walmart OTIF non-negotiable 3% invoice deductions
- • Target Must-Be-Delivered-By (MBD) 5% vendor penalties
- • Costco / Sam’s Club promotional appointment cancellations
8. Obsolescence & Scrap (Cobsolescence)
Agility- • Forced container-load MOQs (50,000–200,000+ units)
- • Regulatory artwork scrap (FDA, barcode, ingredient updates)
- • Unsold seasonal promotional dead-stock write-downs
2. Comprehensive Sourcing Comparison Matrix: Real-World Unit Economics
To illustrate the mathematical disparity between initial FOB invoice quote and true Total Landed Cost, consider an enterprise consumer brand rolling out a high-volume secondary packaging program:
- Program Volume: 10,000,000 units annually (SBS 18pt Straight Tuck Folding Cartons for mass retail).
- Target Channels: Walmart, Target, Costco, and Sam’s Club distribution centers across the Western and Central U.S.
- Corporate Assumptions: WACC = 10.0%, Annual Carrying Rate = 22.0%, Co-Packer Line Speed = 250 units/min ($900/hr downtime rate).
Comprehensive TLC Procurement Matrix (10,000,000 Annual Units / 18pt SBS)
| Cost Driver / Parameter | Asia Offshore Converter (Shanghai) | Domestic U.S. Converter (Midwest) | PM Packaging Nearshore (Baja / SD HQ) |
|---|---|---|---|
| Base FOB Unit Manufacturing Price | $0.220 | $0.310 | $0.260 |
| Production & Converting Lead Time | 4 – 6 Weeks | 4 – 6 Weeks | 10 – 14 Business Days |
| Freight Transit Time to West Coast | 35 – 50 Days (Ocean) | 5 – 8 Days (Cross-Country) | 1 – 3 Days (Dedicated FAST Ground) |
| Total Order-to-Dock Velocity | 12 – 16 Weeks | 5 – 7 Weeks | 2 – 3 Weeks (or JIT/VMI) |
| Landed Cost Increments Per Unit | |||
| Freight & Logistics Cost | $0.052 (Ocean+Port+Dray) | $0.028 (FTL Line-Haul) | $0.012 (Direct Ground) |
| Port Dwell, Demurrage & Chassis | $0.015 | $0.000 | $0.000 |
| Tariffs & Customs (HTS Chapter 48) | $0.044 (20% Sec 301 Avg) | $0.000 (Domestic) | $0.000 (100% USMCA 0%) |
| Pipeline Working Capital Float Cost | $0.008 (120-day float) | $0.003 (35-day float) | $0.001 (14-day float) |
| Warehousing & Carrying Buffer Cost | $0.024 (90-day buffer) | $0.011 (30-day buffer) | $0.004 (10-day buffer) |
| Substrate Moisture Defect & Scrap | $0.018 (2.5% loss rate) | $0.004 (0.5% loss rate) | $0.003 (0.3% loss rate) |
| Automated Co-Packer Line Downtime | $0.014 (Score variance) | $0.002 (Standard run) | $0.001 (Bobst blanking) |
| Retail Non-Compliance & OTIF Penalties | $0.016 (1.5% deduction) | $0.004 (Low risk) | $0.001 (Zero-defect track) |
| Artwork Revision & MOQ Scrap Risk | $0.022 (Bulk MOQ surplus) | $0.005 (Standard batch) | $0.002 (Agile batch runs) |
| TRUE TOTAL LANDED COST PER UNIT | $0.443 | $0.367 | $0.284 |
| ANNUALIZED PROGRAM EXPENDITURE | $4,430,000 | $3,670,000 | $2,840,000 |
| PERMANENT WORKING CAPITAL LOCKED | $1,165,000 | $352,000 | $109,000 |
| NET ANNUALIZED ENTERPRISE SAVINGS WITH PM PACKAGING | BASELINE | +$830,000 vs. Domestic | +$1,590,000 vs. Asia (35.9% Savings) |
Annualized Total Program Cost Comparison
3. Supply Chain Mechanics: Lead Time Latency and Working Capital Economics
The primary driver of cost inflation in overseas packaging programs is not shipping expense alone—it is lead-time friction and the working capital penalty of trapped pipeline inventory.
Supply Chain Velocity & Pipeline Comparison
[PO Issue] → [4-6 Wk Production] → [4-6 Wk Ocean] → [2-4 Wk Port Dwell/Customs] → [U.S. DC Arrival]
• 120 Days Trapped Inventory • Mandatory 60-Day Safety Buffer • Zero Promo Surge Agility[PO Issue] → [10-14 Day Press & Die Converting] → [1-3 Day FAST Ground] → [U.S. DC Arrival]
• 14–21 Days Total Velocity • 10-Day Safety Stock • Same-Week Agile Batch ScalingThe Working Capital Drag Formula
When managing an enterprise packaging category, procurement directors must account for the opportunity cost of capital. Cash committed to packaging floating on an ocean vessel cannot be deployed for core growth, product R&D, or retail promotions.
Annual Inventory Carrying Cost Formula
4. Quality Assurance, Substrate Integrity, and Automated Line Runnability
A major flaw in traditional procurement scorecards is isolating packaging purchasing from downstream contract packaging operations. Packaging that is purchased “cheaply” but runs poorly on automated packaging lines severely damages gross margins.
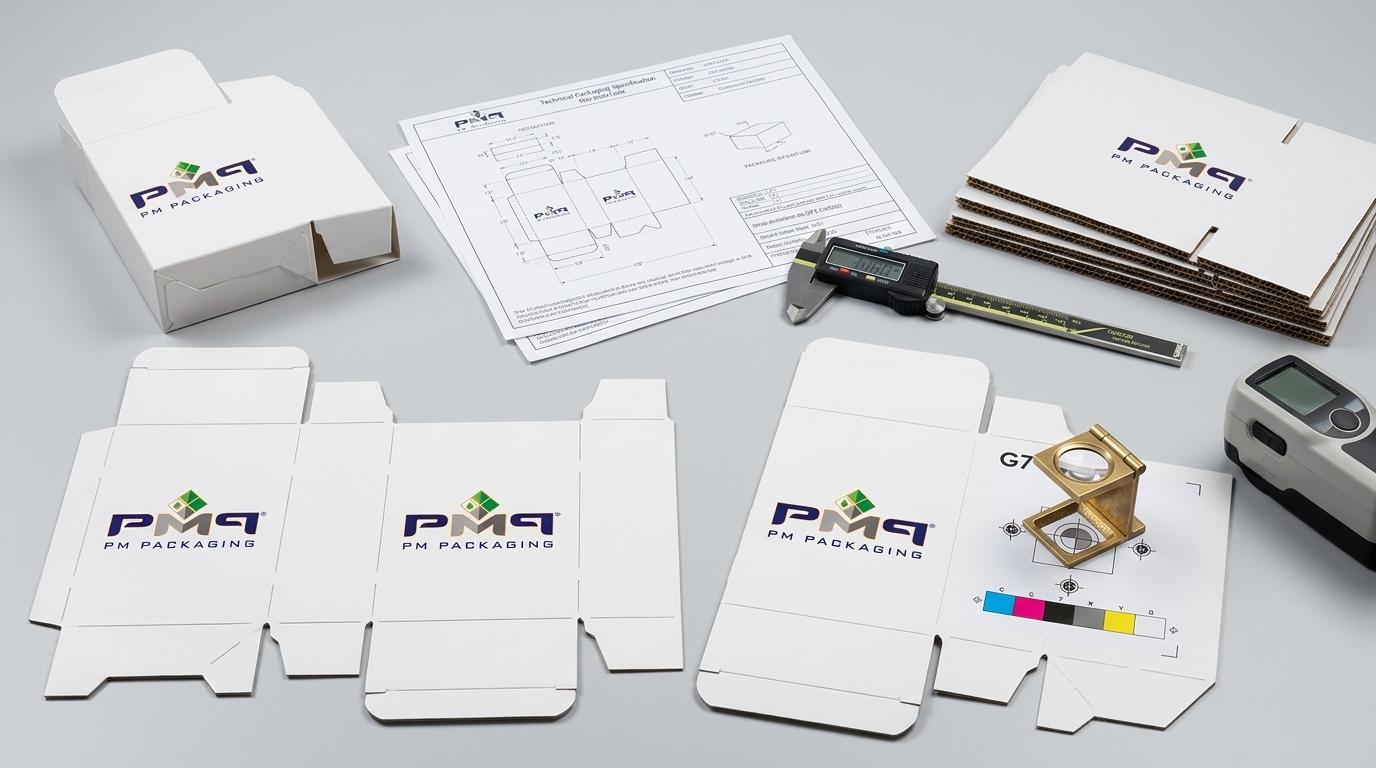
Transpacific Substrate Degradation
Paperboard is inherently hygroscopic. During 30 to 50 days in transpacific ocean transit inside unconditioned steel containers, relative humidity frequently exceeds 85%, causing three primary mechanical failure modes:
1. Fiber Crease Relaxation
Moisture absorption alters calibrated Taber score bending stiffness by 30% to 50%, causing pre-break folding failures and automated cartoner jams at 150–400 cartons/minute.
2. SFL Microflute Delamination
Ocean humidity breaks down starch adhesives in Single Face Laminate (E/F-flute), reducing Edge Crush Test (ECT) and Box Compression Test (BCT) top-load stacking strength by up to 40%.
3. Ink & Coating Scuffing
Vibrational friction during maritime transit combined with container condensation produces scuffing across high-gloss and soft-touch finishes, causing retail GMI rejection.
5. Trade Compliance: USMCA Rules of Origin vs. Section 301 Tariffs
Importing printed packaging into the United States requires navigating complex customs regulations. Procurement teams must account for the stark tariff differences between Asian paperboard imports and USMCA-certified nearshore manufacturing:
Tariff & Trade Compliance Matrix (HTS Chapter 48)
| Trade Dimension | Asian Offshore Sourcing (China) | PM Packaging Nearshore (Baja California) |
|---|---|---|
| Base MFN Duty (HTS 4819.10 / .20) | 0.0% to 3.0% | 0.0% (Duty-Free) |
| Section 301 Trade Tariffs | 7.5% to 25.0%+ (List 3 & List 4) | 0.0% EXEMPT (USMCA Qualified) |
| Antidumping & Countervailing Duty | Frequent trade investigations | 0.0% EXEMPT |
| North American Rules of Origin | Non-Compliant | 100% USMCA Chapter 48 CTH Compliant |
| Customs Processing & Border Security | Standard Maritime Entry / Dwell | IMMEX Certified / C-TPAT FAST Lanes |
| Anti-Forced Labor (UFLPA) Audit Risk | High inspection hold frequency | 100% Certified North American Paper Mills |
6. Channel Execution: Retail Rollouts, Dieline Selection & Product Line Optimization
To minimize Total Landed Cost, structural packaging engineers and procurement category managers must match the product line, dieline geometry, and retail channel requirements with the optimal manufacturing configuration:
Dieline Efficiency & Pack-Out Speed Trade-Off Matrix
| Dieline Style | Erecting Method | Pack-Out Speed | Tooling Investment | Primary Channel Fit |
|---|---|---|---|---|
| Straight Tuck End (STE) | Automated Cartoner | 150 – 400+ units/min | $2,500 | Mass Retail (Walmart, Target) |
| Reverse Tuck End (RTE) | Automated Cartoner | 120 – 300 units/min | $2,200 | Retail Shelf Displays & OTC |
| Auto-Bottom (Crash-Lock) | Manual / Semi-Auto | 30 – 60 units/min | $3,800 | Short-Run Co-Packing & Promos |
| Snap-Lock Bottom (1-2-3) | Manual Assembly | 20 – 40 units/min | $2,800 | Heavy Hardware & Automotive |
| Glued Tamper Sleeve | Automated Inserter | 200 – 500+ units/min | $1,800 | Club Multipack Bands & Food |
Litho-Laminated SFL for Club Stores
For heavy retail items, beverage carriers (4, 6, 8, 12, 24-packs with reinforced die-cut handles), and Costco/Sam’s Club full-pallet displays, PM Packaging’s Single Face Laminate (E, F, and B-flute) combines 200-line offset graphics with extreme Box Compression Test (BCT) top-load stacking strength.
qikCombo™ Shared Run Blister Cards
For multi-SKU hardware, automotive, and beauty catalogs, our proprietary qikCombo™ program gangs 5 to 20 distinct part numbers onto standardized master sheets—delivering high-volume pricing on 5,000 to 100,000 unit batches with guaranteed 10-business-day turnaround.
7. The 6-Step Enterprise Total Landed Cost Audit Playbook
Procurement Directors and Packaging Category Managers can execute this 6-step audit framework to evaluate existing packaging suppliers and model the financial impact of nearshore re-sourcing:
Extract Real Base Manufacturing Rates
Strip out all non-manufacturing line items (freight, tooling, plate amortization) from supplier quotes to isolate true substrate, press, and converting costs. Ensure substrate calipers and coatings are directly comparable.
Capture Trailing 12-Month Freight & Demurrage Invoices
Do not rely on baseline ocean freight estimates. Audit actual historical freight invoices—including spot market rate spikes, fuel surcharges, port drayage, chassis split fees, and terminal demurrage penalties incurred during peak retail seasons.
Verify HTS Tariff Classification & Origin Documentation
Audit product HTS classifications under Chapter 48. Ensure overseas quotes reflect Section 301 tariff burdens (7.5%–25%+). For nearshore quotes, verify valid USMCA Certificates of Origin demonstrating Chapter 48 tariff shift compliance.
Calibrate Co-Packer Runnability and Scrap Rates
Consult directly with contract packaging line managers. Document historical line-jam frequencies, score fracture incidents, and board scrap percentages. Quantify line downtime at $900 to $1,500 per hour and factor into the landed cost model.
Calculate Working Capital & Inventory Float Cost
Calculate total cash locked in transit and safety stock using corporate WACC. Factor in 3PL warehouse storage fees for buffer inventory required by 90-day offshore pipelines versus 14-day nearshore replenishment cycles.
Audit Supplier Dual-Plant Machine Redundancy
Verify that the packaging converter operates mirrored equipment across multiple physical manufacturing sites. PM Packaging’s dual-plant footprint across Tijuana and Mexicali ensures complete disaster recovery redundancy, preventing single-point-of-failure shutdowns.
Ready to Audit and Optimize Your Packaging Total Landed Cost?
For enterprise brands competing in modern mass retail, managing packaging procurement solely through initial FOB quotes is an outdated, high-risk strategy. The true financial performance of a packaging program is governed by Total Landed Cost—where speed, geographic proximity, trade compliance, and flawless converting quality dictate bottom-line profitability.
Whether you are planning a nationwide mass retail rollout, transitioning high-volume folding cartons to nearshore manufacturing, or auditing your supply chain’s total landed cost, PM Packaging delivers the technical precision, scale, and supply chain agility required by industry-leading enterprise brands.
Partner with PM Packaging’s Commercial Engineering Team
- Comprehensive Total Landed Cost Modeling: Complete mathematical TLC audit of your active secondary packaging portfolio.
- 100% USMCA Tariff-Free Transition: Move vulnerable Asian supply chains to nearshore manufacturing with 1–3 day ground transit.
- Vendor-Managed Inventory (VMI) & qikCombo™: Eliminate dead-stock write-downs and unlock permanent corporate liquidity.